Overview of the Market
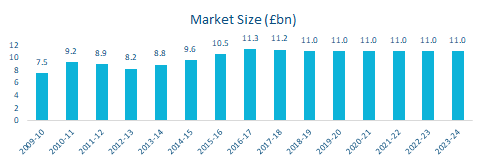
The estimated market size of the recruitment industry in the U.K. is £11bn. The industry experienced a healthy compound annual growth rate (CAGR) of 4.5% from 2014-19. The performance of the Employment Placement Agencies industry is closely linked to the hiring intentions of public (and private) sector firms. and, consequently, to prevailing economic conditions. As such, industry revenue contracted by over 40% in 2009-10 due to the effects of the global financial crisis. The industry has since recovered but has not yet reached its pre-recessionary peak. In the current year, revenue is expected to fall by 2% to £11 billion. This contraction is largely expected to be a result of the uncertainty surrounding the terms of the UK’s exit from the European Union. In addition, public-sector job cuts are likely to restrict revenue growth to some extent.
A CAGR of (0.1%) is forecast for the following 5 years (2019-2024). This marginal fall in industry revenue can be attributed to the prevalence of uncertainty surrounding the UK’s forthcoming exit from the European Union. The number of people looking to switch roles in order to advance their careers is expected to rise, thereby supporting demand. Although demand from the public sector is expected to grow slightly during the five-year period through 2023-24, the level of growth is expected to be constrained due to expenditure restrictions. Business confidence is forecast to remain muted. Online job-search websites will remain a relatively minor threat to the industry as the personalised nature of the industry’s services ensures that it will remain relevant.

Recruitment Companies
A profitability analysis on the sector from a pool of 2,000 leading UK-based Recruitment companies within the sector revealed the following points:
- The 791 most profitable companies in the sector made an average profit margin of 4.5%
- The least profitable 1,209 made an average profit margin of 0.0%; the industry average was 1.5%
- 737 companies increased in value over the year with 368 of all companies increasing by more than 25%
- Of the 792 companies that decreased in value, 385 fell by more than 25%
Based on this analysis, companies were rated on their ‘takeover attractiveness’. A total of 996 companies were given the highest rating of ‘Strong’. Where as 298 companies were rated as being in ‘Danger’. A total of 323 Recruitment companies were highlighted as highly attractive takeover prospects with a further 1,421 being highlighted as ‘worth considering’.
183 companies continue to sell at a loss for the 2nd year running. Serial loss makers are adding to the congestion in the market, often undercutting competition and driving down profit margins across the board. The next 12 months are pivotal for these companies; they must operate more efficiently or run out of cash.
M&A Activity in the Sector
Statistics indicate a total of 377 significant deals from January 2011 to August 2018 in the Recruitment industry. Typically, only deals over £500k are registered including management buy-ins (MBIs), management buy-outs (MBOs) and secondary MBOs.
Upon breaking down the deal type, M&A, activity within the sector is mainly categorised by acquisitions, with 295 since January 2011. There were also 56 MBOs, 11 secondary MBOs and 15 mergers, a large amount for an industry of this size, suggesting that it is an attractive industry for private equity. A geographical breakdown of the deals shows that the London dominates M&A activity, benefitting from 99 deals in the time frame, the South East was the closest region with 59 deals being completed.
Deal flow has been significant in each year with a gradual upwards trend through 2013-2016. Deal levels then fell in 2017, which is characteristic of the uncertainty effect of the UK’s exit from the EU. Without the clarity that a deal will bring, UK businesses are highly likely to be risk adverse. This is justified further by the YTD 2018 figures, with 26 deals through August 2018, forecasting the same rate to the end of the year gives 39 deals. This would be another reduction in M&A levels.
Industry Benchmarking Information – September 2018
Hallidays’ client base consists of small to lower mid-market enterprises. Our benchmarking analysis reflects businesses with turnover below £20m, in line with the majority of our clients in this sector.
| Marketing Agency Benchmarking Data | Mean | Median | Lower Quartile | Upper Quartile |
|---|---|---|---|---|
| Turnover Growth/Decline (%) | 2.09 | 0.24 | (19.49) | 16.70 |
| EBIT Margin (%) | 3.37 | 3.09 | (0.05) | 7.76 |
| EBIT Growth/Decline (%) | (18.69) | (23.44) | (85.26) | 32.29 |
| EBITDA Margin (%) | 3.91 | 3.39 | 0.15 | 8.37 |
| EBITDA Growth/Decline (%) | (16.55) | (18.97) | (79.21) | 39.04 |
| Total Net Assets Growth/Decline (%) | 10.24 | 5.99 | (9.34) | 19.61 |
| Current Ratio | 12.65 | 9.90 | (5.66) | 36.69 |
| Acid Test | 3.18 | 1.37 | 1.00 | 2.39 |
Benchmarking Criteria
Using full company accounts filed in the last two years.
Search Criteria: SIC-Code “781 – Activities of employment placement agencies” or “782 – Temporary employment agency activities”. Excluding companies with nil turnover in either period.
Turnover below £20m.
M&A Activity Source
Experian Market IQ (August 2018) Search Criteria: SIC-Code “781 – Activities of employment placement agencies” or “782 – Temporary employment agency activities”