Overview of the Market
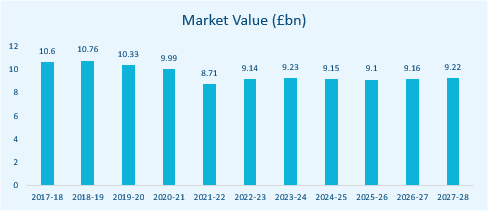
The U.K. printing industry has an estimated market size of £9.1bn in 2021., a 0.9% increase on the previous year. The industry experienced a compound annual growth rate (CAGR) of (2.9%) through the five years to 2021-22. The constrained nature of the industry’s performance over the past five years is attributed to digital alternatives to printed materials, such as e-books, growing rapidly in popularity over the period.
The industry contracted significantly in 2020-21 due to volatile commodity prices and falling downstream demand conditions caused by the COVID-19 pandemic. The outbreak led to enforced business closures and more cautious spending from consumers due to uncertain economic conditions. Additionally, industry imports and exports both declined significantly in 2020-21 due to the supply chain and trade restrictions created by pandemic.
Industry revenue is expected to grow at a modest compound annual rate of 0.2% over the five years through 2026-27, to reach £9.2 billion. The industry is expected to continue to face fierce competition from substitutes for commercially printed material, such as online advertising and publication of information. Many retailers, financiers and service providers are expected to move their operations online, limiting demand for industry services. Commercial printers are anticipated to introduce different services to increase revenue and remain profitable, but some of these services will not be relevant to the industry.

Operating Conditions
The Printing industry has a moderate level of capital intensity. On average, an estimated £7.16 is spent on labour for every £1.00 spent on capital. Operators are increasingly investing in equipment and machinery that improves efficiency because it can allow firms to maintain a particular level of output while reducing wage costs.
The industry exhibits a low level of technological change. The technology used in the printing industry depends on the type of printing process employed. New innovations in the Printing industry include high speed digital printing on demand and hybrid print processes.
The industry exhibits a low level of revenue volatility. The moderate level of revenue volatility at the beginning of the period was largely caused by the prolonged effects of the global economic crisis in 2008, which led to a considerable decline in industry revenue. Favourable economic conditions as the economy recovered from the crisis are expected to have benefited downstream industries, limiting the fall in revenue caused by a decline in popularity of printed books.

M&A Activity in the Sector
Market IQ data indicates a total of 249 significant deals in the industry from January 2011 to October 2021, with UK targets. Deals are only reported over a certain value threshold (c.£500k), therefore, it is likely that not all deals have been captured. Data consists solely of Acquisitions, Management Buy-outs, Management Buy-ins, Secondary Buy-outs and Mergers
Upon breaking down the deal type, M&A activity within the sector is mainly categorised by acquisitions, with 200 since January 2011. There were also 33 MBOs and 11 mergers. A geographical breakdown of the deal shows that the North West dominates M&A activity, closely followed by London, benefitting from 35 and 34 deals respectively. The remaining deals are spread through the U.K.; slowly declining in number to Northern Ireland, with only 4 deals.
Deal flow has been significant in each year, with a slight downwards trend through 2011-2014, followed by a recovery period until 2019, when the COVID-19 pandemic hit.
Forecasting the YTD figure of 4 deals through to the end of 2021 gives a total of 5 deals. However, since the industry is forecast slight growth through 2027, there may be some positive effect on deal activity.
Industry Benchmarking Information – December 2021
Hallidays’ client base consists of small to lower mid-market enterprises. Our benchmarking analysis reflects businesses with turnover below £20m, in line with the majority of our clients in this sector.
| Printing Benchmarking Data | Mean | Median | Lower Quartile | Upper Quartile |
|---|---|---|---|---|
| Turnover Growth/Decline (%) | (8.27) | (8.66) | (26.92) | 4.34 |
| EBIT Margin (%) | 1.62 | 2.71 | (2.78) | 6.51 |
| EBIT Growth/Decline (%) | (23.31) | (18.40) | (84.17) | 33.44 |
| EBITDA Margin (%) | 6.34 | 5.72 | 1.23 | 12.44 |
| EBITDA Growth/Decline (%) | (16.93) | (14.75) | (57.99) | 27.75 |
| Total Net Assets Growth/Decline (%) | (4.26) | 0.46 | (16.65) | 10.79 |
| Current Ratio | 2.36 | 1.38 | 0.89 | 2.47 |
| Acid Test | 2.13 | 1.21 | 0.71 | 2.12 |
Benchmarking Criteria
Using full company accounts filed in the last two years, excluding companies with nil turnover in either period.
Search Criteria: SIC-Code “181 Printing and service activities related to printing”.
Turnover below £20m.
M&A Activity Source
Experian Market IQ (December 2021)
Search Criteria: SIC-Code “181 Printing and service activities related to printing”.