Overview of the Market
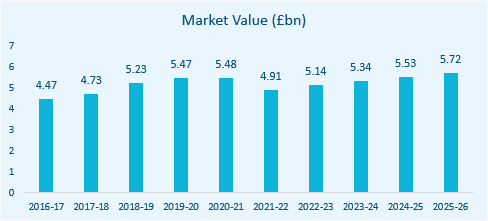
In the UK, the Market Research and Public Opinion Polling industry is estimated to be worth a value of £5.1bn, with a growth rate of 1.7% between 2017 and 2022. This is forecast to increase to 3.8% from 2022 to 2027. With technological investment, players have aimed to develop sophisticated methods of data collection and analysis. Market research services are correlated with business investment as firms look to evidence the rationale for expansion and innovation.
The roll-out of COVID-19 (coronavirus) vaccines in the United Kingdom, labelled as largely successful and anticipated to allow the lifting of all restrictions from 21 June 2021 has provided a boost to confidence and suggests an imminent and robust economic recovery. This is likely to support demand for industry services. As a result, revenue is forecast to rise by 4.6% in 2021-22 to reach £5.1 billion.
Industry revenue is expected to grow over the next five years through 2026-27 to reach £6.2 billion, owing to rebounding business confidence and higher spending levels. Strong advertising activity and demand for media research is anticipated to support growth for companies specialising in web-based market research. As e-commerce continues to grow, firms are likely to increasingly invest in new research technology and specialised data analytics technologies. Demand from the public sector is also expected to continue to rise, as the government has committed to boosting public spending.

Operating Conditions
The level of capital intensity within the Market Research industry is relatively low. This is highlighted by the fact that for every £1.00 spent on capital, an estimated £12.16 is spent on labour. The industry is highly labour-intensive, as human knowledge and labour are the primary inputs for delivering the services it provides.
Technological change is happening at a moderate rate in this industry due to major operators continuing to explore new technology in order to better collect and analyse data. One emerging segment of the industry focuses on the measurement of online media.
Due to the industry being so closely linked with the level of corporate advertising, profit and business confidence, revenue volatility in the industry is moderate. Revenue levels generally fall in line with increases and reductions in business confidence that has a trickle down affect through the economy. In 2021-22, revenue is anticipated to increase by 4.6%, as economic recovery and improving market conditions will likely aid business confidence and in turn spending on market research.
M&A Activity in the Sector
Market IQ data indicates a total of 96 significant deals in the industry from January 2011 to September 2021, with UK targets. Deals are only reported over a certain value threshold (c.£500k), therefore, it is likely that not all deals have been captured.
Upon breaking down the deal type,
M&A, activity within the sector is
mainly categorised by acquisitions,
with 82 since January 2011. There were also 9 MBOs, 3 merger’s and 1 SBO. A geographical breakdown of the deals shows that London dominates M&A activity, benefitting from 39 deals in the time frame. The South East was the closest behind with 12 deals being completed.
Deal flow has been scattered in each year with an up and down pattern from 2011 to 2016 with a significant dip taking place in 2013, characteristic of post-recession after-effects. There has been a downwards trend in deals since 2019, characteristic of the COVID-19 pandemic. With 2021 YTD deal numbers, forecasting to the end of the year gives a total of 6 deals, showing a continuing downwards trend.
Industry Benchmarking Information – September 2018
Hallidays’ client base consists of small to lower mid-market enterprises. Our benchmarking analysis reflects businesses with turnover below £20m, in line with the majority of our clients in this sector.
| Market Research Benchmarking Data | Mean | Median | Lower Quartile | Upper Quartile |
|---|---|---|---|---|
| Turnover Growth/Decline (%) | 4.42 | (0.09) | (18.16) | 14.33 |
| EBIT Margin (%) | 2.66 | 4.89 | (2.61) | 11.32 |
| EBIT Growth/Decline (%) | (8.59) | (2.16) | (80.90) | 21.95 |
| EBITDA Margin (%) | 4.42 | 6.92 | (1.87) | 14.67 |
| EBITDA Growth/Decline (%) | 9.50 | 2.88 | (60.18) | 51.42 |
| Total Net Assets Growth/Decline (%) | (5.71) | (0.36) | (39.34) | 17.42 |
| Current Ratio | 2.50 | 1.43 | 0.99 | 2.95 |
| Acid Test | 2.49 | 1.43 | 0.96 | 2.95 |
Market Research Benchmarking
Using full company accounts filed in the last two years under the SIC-Code “732 – Market research and public opinion polling”. Excluding companies with nil turnover in either period, we have summarised key benchmarking information for businesses under £20m turnover in the table above. September 2021.
M&A Activity Source
Experian Market IQ (September 2021)
Search Criteria: SIC-Code “732 – Market research and public opinion polling”.