Overview of the Market
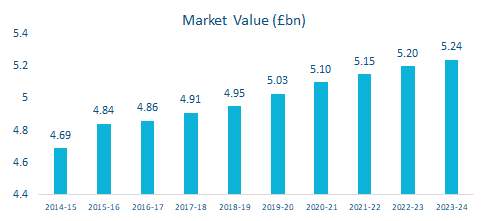
The UK Footwear Retail market is estimated to be worth approximately £5bn and is forecast to expand by 1.2% per annum until 2024. The footwear retail market has enjoyed five years of strong and consistent growth rates, as a result of strong consumer confidence and rising incomes. Innovations within the industry, such as the rise of online retailing and click-and-collect services, have enabled retailers to unlock further growth but has also increased competition.
In recent years, a key theme running throughout the footwear retail market is the rising popularity of trainers and more casual styles of shoe. Retailers have had to adapt their offerings in order to profit from these changing customer preferences. There has also been an increase in clothing retailers bolstering their footwear offerings to compete with specialist stores.
The industry is forecast to continue growing over the next five years, however operators will need to introduce new strategies in order to limit the effects of competition. Footwear retailers have been fairly slow to adapt stores in the interest of improving the shopping experience, a concept that external rivals have wholly embraced. Growing external competition is likely to force industry operators to adjust and increase technology investment in the interest of sustained competitiveness. Regardless, consolidation is likely to occur, particularly at the lower value end of the industry, as footwear retailers continue to battle with supermarkets and major clothing retailers for market share. Online and mobile commerce sales are expected to account for a growing proportion of total industry revenue. Revenue is forecast to increase at a compound annual rate of 1.1% over the five years through 2023-24 to reach £5.2 billion.

Footwear Retail Companies
A profitability analysis on the sector from a pool of 287 leading UK-based Footwear Retail companies revealed the following points:
- The most profitable 78 companies benefitted from an average profit margin of 5.9%
- The least profitable 209 companies made an average profit margin of (0.2%); the industry average is 1.0%
- 86 Footwear Retail companies increased in value over the year with 38 companies increasing by more than 25%
- 116 companies decreased in value, 46 fell by more than 25%
- 62 companies have made a loss for two consecutive years
Based on analysis, companies were rated on their ‘takeover attractiveness’. A total of 110 companies were given a ‘Strong’ rating whereas 73 companies were given the lowest rating, ‘Danger’. 46 companies in the industry were highlighted to be highly attractive takeover prospects. London was the most attractive region for takeover prospects.

M&A Activity in the Sector
Market IQ data indicates a total of 46 significant deals in the industry from January 2011 to October 2018, with UK targets. Deals are only reported over a certain value threshold (c.£500k), therefore, it is likely that not all deals have been captured.
Upon breaking down the deal type, M&A activity within the sector is mainly categorised by acquisitions, with 41 since January 2011. There were also five management buy-outs. A geographical breakdown of the deals shows that the London dominates M&A activity, benefitting from 16 deals in the time frame. The South West was the closest, with 5 deals being completed. The rest of the deals are spread throughout other regions whilst slowly declining to Wales, with only one deal.
Deal flow has been reasonably small in each year with a downwards trend through 2011-2016. This contraction is characteristic of the after effects of the recession that ended in 2012. Brexit has clearly had an effect on M&A levels in the industry. In 2017, growth levels were good when compared to 2016. The contraction of M&A levels then continued. Forecasting ahead till the end of the year, following current trends gives only two to three deals. This contraction is due to the uncertainty that the EU referendum has caused in the past two years.
Industry Benchmarking Information – September 2018
Hallidays’ client base consists of small to lower mid-market enterprises. Our benchmarking analysis reflects businesses with turnover below £20m, in line with the majority of our clients in this sector.
| Footwear Retail Benchmarking Data | Mean | Median | Lower Quartile | Upper Quartile |
|---|---|---|---|---|
| Turnover Growth/Decline (%) | (2.01) | (0.77) | (22.55) | 4.85 |
| EBIT Margin (%) | (5.64) | (0.79) | (21.86) | 22.03 |
| EBIT Growth/Decline (%) | 3.68 | (6.07) | (43.83) | 32.92 |
| EBITDA Margin (%) | (3.65) | 0.99 | (17.99) | 7.34 |
| EBITDA Growth/Decline (%) | 5.38 | (3.04) | (47.07) | 40.06 |
| Total Net Assets Growth/Decline (%) | (13.41) | (9.94) | (42.69) | 12.98 |
| Current Ratio | 1.91 | 1.06 | 0.69 | 2.18 |
| Acid Test | 1.23 | 0.84 | 0.39 | 1.40 |
Footwear Retail Benchmarking
Using full company accounts filed in the last two years under the SIC-Code “47721 – Retail sale of footwear in specialised stores” or “4772 – Retail sale of footwear and leather goods in specialised stores”, Excluding companies with nil turnover in either period, we have summarised key benchmarking information for businesses under £20m turnover in the table above. September 2018.
M&A Activity Source
Experian Market IQ (October 2018)
Search Criteria: SIC-Code “47721 – Retail sale of footwear in specialised stores” or “4772 – Retail sale of footwear and leather goods in specialised stores”.